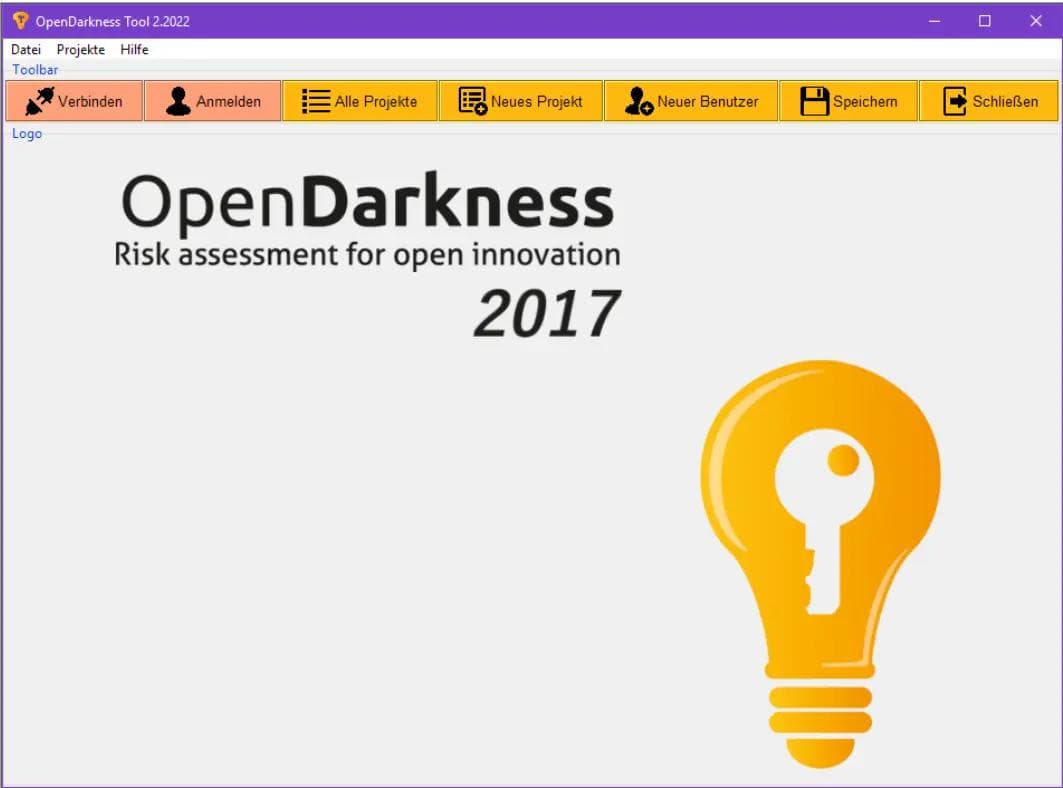
OpenDarkness
Developed a self-assessment tool for SMEs to evaluate Open Innovation risks and opportunities. Provides comprehensive insights on organizational, legal, and knowledge management aspects.
Overview & Background
Problem Statement: While open innovation processes foster collaboration, they also introduce risks like uncontrolled intellectual property (IP) leakage or free riding. For academic research, there was a critical need to systematically analyze this "dark side" and extract patterns and statistical metrics from empirical data. A user-friendly tool for data input, analysis, and visualization was missing.
Motivation: To develop a specialized IT tool that empowers researchers to efficiently manage and visually prepare data related to the "openness-control paradox," facilitating hypothesis testing and the derivation of actionable recommendations.
Outcomes: The "Open Darkness" tool significantly enhanced the research team's ability to conduct more efficient and precise analyses of data related to the dark side of open innovation. It played a crucial role in validating hypotheses and supported the creation of scientific publications through automated data visualization.
Lessons Learned:
- Gained in-depth knowledge in the design and development of desktop applications with Python.
- Acquired experience in implementing complex statistical computations and visualizing them effectively.
- Strengthened skills in integrating Python applications with traditional web server and database architectures (LAMP stack).
- Mastered the challenge of preparing scientific data intuitively and visually appealingly to make complex relationships understandable.
My Role
Lead Developer & Data Visualization Specialist
Project Duration
6 month
Technical Details
Technologies Used
Challenges & Solutions
Challenge 1
Intuitive Visualization of Research Findings:
Collected and computed data had to be displayed in a clear, scientifically sound, and easily interpretable graphical format to reveal trends and patterns. Selecting the appropriate chart types and accurately representing statistical means was crucial.
Solution
Implemented graphs and diagrams using [Name the specific graphing tool here, e.g., Matplotlib/Plotly/Seaborn]. This enabled the creation of line, bar, or scatter plots for visualizing trends and distributions, with an emphasis on correct scaling and labeling suitable for scientific publications.
Challenge 2
Complex Data Analysis and Statistical Computations:
The application needed to process large datasets and perform sophisticated statistical operations (e.g., calculating means, standard deviations, and trends over time).
Solution
Leveraged NumPy in Python for efficient numerical computations and statistical analyses, ensuring precise results for research inquiries.